Capital Spending for School Districts is a Local Affair
The Tennessee Comptroller’s Office has released a report detailing the amount and types of capital spending for local school districts and an overview of the methods districts and local governments use to pay for capital and debt spending.
Spending for public school capital projects by both local school districts and their county and city governments totaled an estimated $2 billion in fiscal year 2019-20, including spending for land; building construction and renovation; related facilities like parking lots and athletic fields; as well as equipment like desks, chairs, playground equipment, and buses.
The bulk of capital spending on K-12 school facilities, and any related debt payments on loans, is paid from local revenues, including revenues from bonds and notes issued by local governments, adequate facilities taxes, and dedicated property taxes. The state supports capital spending for schools primarily through the state’s share of Basic Education Program (BEP) funding for several components related to capital needs. State dollars allocated in fiscal year 2019-20 totaled $503 million for the BEP’s capital outlay, equipment, and technology components. (The BEP’s capital outlay component will be folded into the newly-approved Tennessee Investment in Student Achievement (TISA) base funding formula, which will be implemented in school year 2023-24. Equipment and technology components are to be split between TISA’s base, weighted, and direct funding components.)
The report reviews the factors that can increase capital spending for schools, including student enrollment growth, classroom size limit, the age and quality of school buildings, and the cost of building materials and labor. The report’s focus on spending and revenue data from 2019-20 captures more typical spending patterns that occurred mainly before the onset of the COVID-19 pandemic and the large injections of federal emergency relief funds known as ESSER.
A total of 35 districts were identified in the report as having total enrollment growth of 2 percent or more across the period from 2014-15 to 2019-20. These districts were more likely to be in Middle Tennessee and to be city or special school districts.
Five-year enrollment change in school districts | 2014-15 to 2019-20
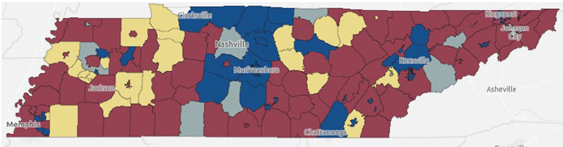
These growing districts identified a number of challenges associated with expanding learning space. Those challenges include rising construction costs and local tax revenues not keeping pace with the needs of a growing population. Some districts use portable classrooms and shift music and art classes out of fixed classrooms to create more space while preparing for building expansions and new construction. District officials also said the funding needed for new buildings can leave less money available for maintenance of existing buildings.
To read the report, please visit the Comptroller’s website at: tncot.cc/orea.
Follow us on twitter @TNCOT and Instagram @tncot
Media contact: John Dunn, Director of Communications, 615.401.7755 or john.dunn@cot.tn.gov
Related Links: