State Assessments - Grade 3-8 TCAP Achievement Tests
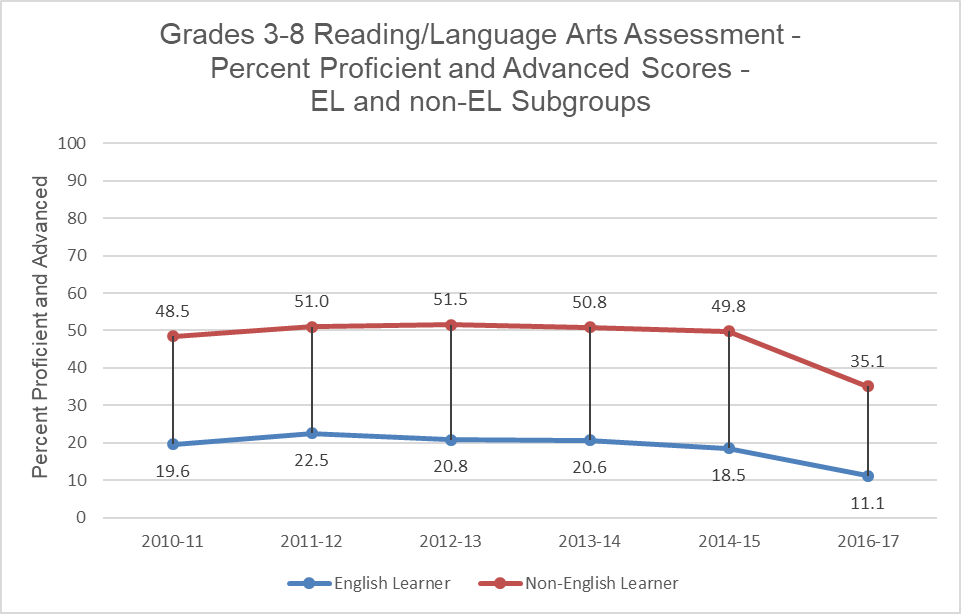
English Learners
On average, English Learner (EL) students’ academic achievement levels tend to be low, according to state and national test results. One possible reason for this is that the EL subgroup, by definition, is made up of students with low levels of English proficiency, an obstacle to academic success in U.S. schools. Unlike other subgroups, students who reach proficiency move out of the EL subgroup while those with lower levels continually move into the subgroup. Further, researchers suggest EL test results should be considered with caution: students may not perform well on assessments, which may be affected not by a lack of knowledge, but by a lack of language fluency instead. This can be true even of students who seem to have made progress in developing English proficiency – students, for example, may have acquired a high level of oral fluency, but may lack the advanced academic language needed to do well in school.
In Tennessee, about 5.3 percent of students in public schools in the 2016-17 school year were English Learners.
The charts below show the difference in the percent of English learners and non-English learners achieving a level of advanced or proficient on Tennessee assessments in math and reading/language arts for grades 3-8 for school years 2010-11 through 2016-17. (No information is provided for 2015-16 because state testing was suspended for grades 3 through 8 that school year. A new test was given in 2016-17, which is the reason for the decrease in scores shown for that year.)

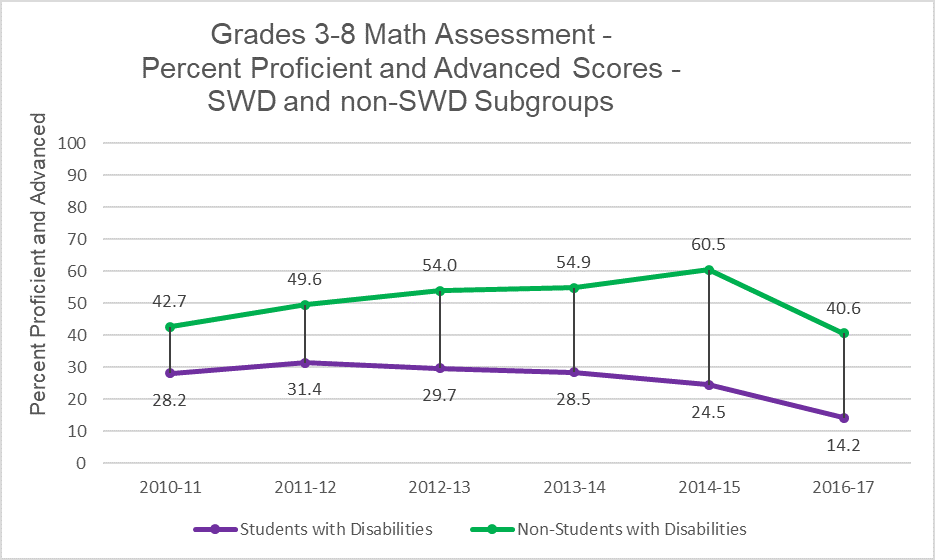
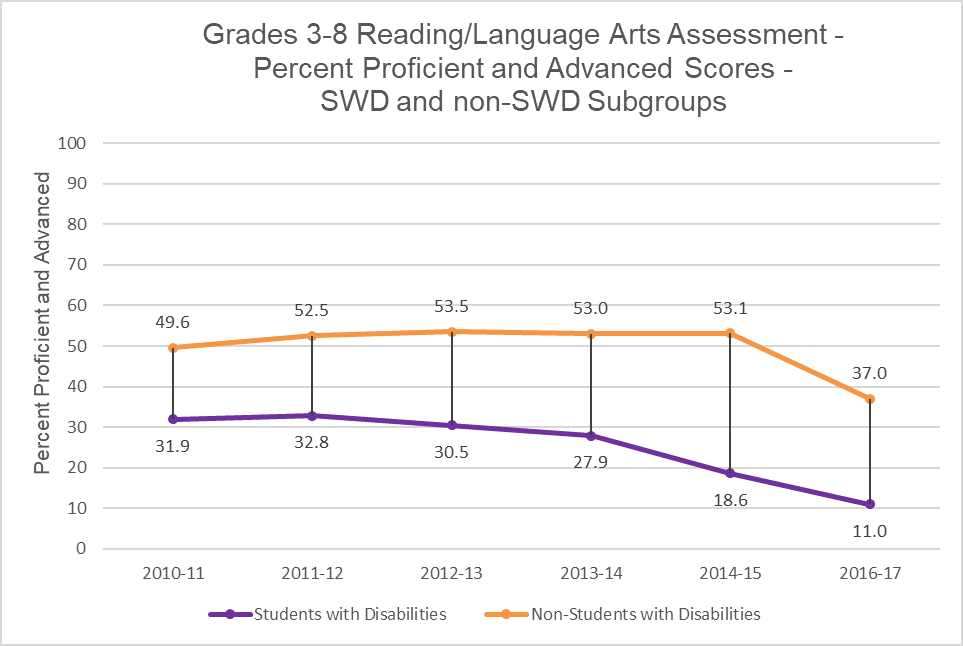
Students With Disabilities
Students with disabilities tend to score lower than their peers on state and National Assessment of Educational Progress (NAEP) exams. Despite increased federal oversight of academic outcomes for students with disabilities, as well as other subgroups, achievement gaps continue across all states. The Tennessee Department of Education has undertaken a number of approaches to improve outcomes for students with disabilities, including providing more regional support to districts, increasing district- and state-level monitoring of student Individualized Education Program (IEP) plans, and using district-level data to determine specific areas of need, which are used to develop improvement plans that include both recommended and required tasks.
In 2014-15, Tennessee phased out the Modified Academic Achievement Standards (MAAS) assessment, and instead began providing supports to help students with disabilities transition to standard assessments. 1
In the 2016-17 school year, about 13.9 percent of students in Tennessee public schools qualified to receive special education services.
The charts below show the difference in the percent of students with disabilities and students without disabilities achieving a level of advanced or proficient on Tennessee math and reading/language arts assessments for grades 3-8 for school years 2010-11 through 2016-17. (No information is provided for 2015-16 because state testing was suspended for grades 3 through 8 that school year. A new test was given in 2016-17, which is the reason for the decrease in scores shown for that year.)
1 The MAAS was an assessment that Tennessee and some other states used to evaluate the performance of students with disabilities whose progress in response to classroom instruction made it unlikely that they would achieve grade-level proficiency. States could deem up to 2 percent of students proficient using a MAAS assessment. Under federal regulations issued in August 2015, the use of a MAAS assessment is no longer permitted.
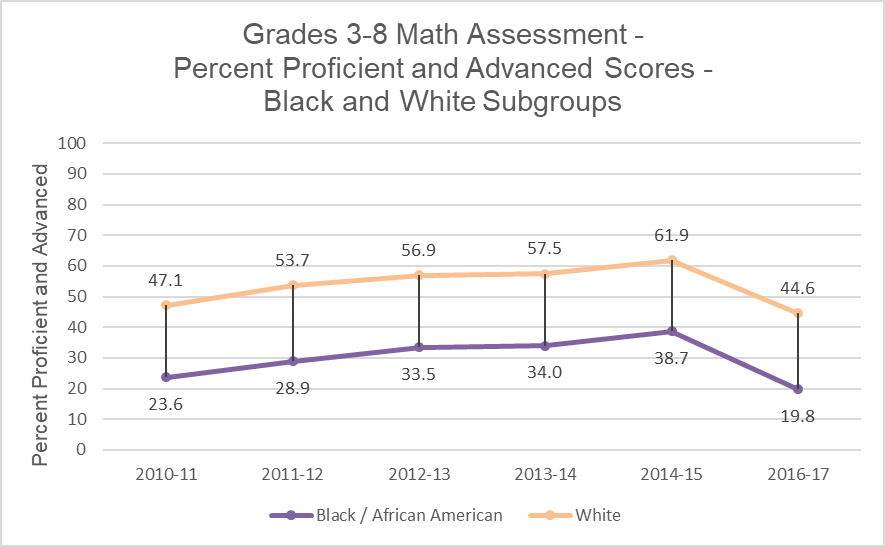
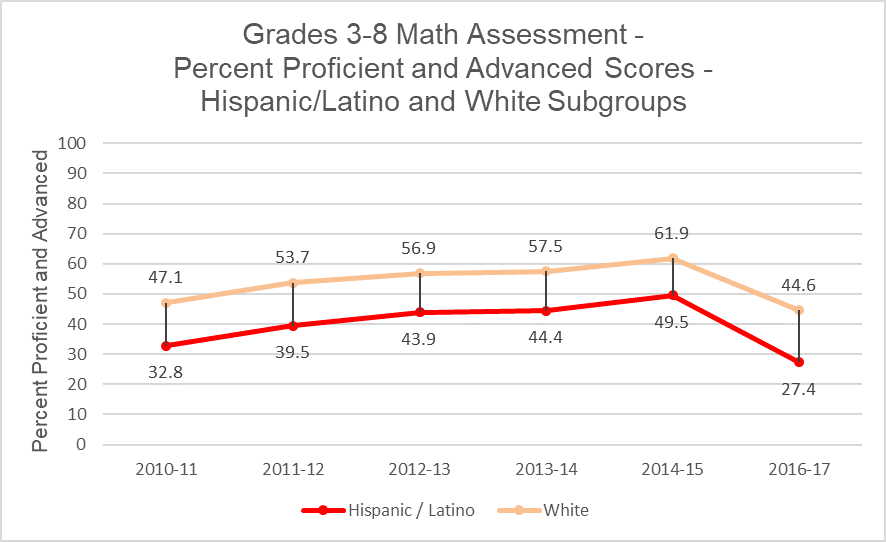
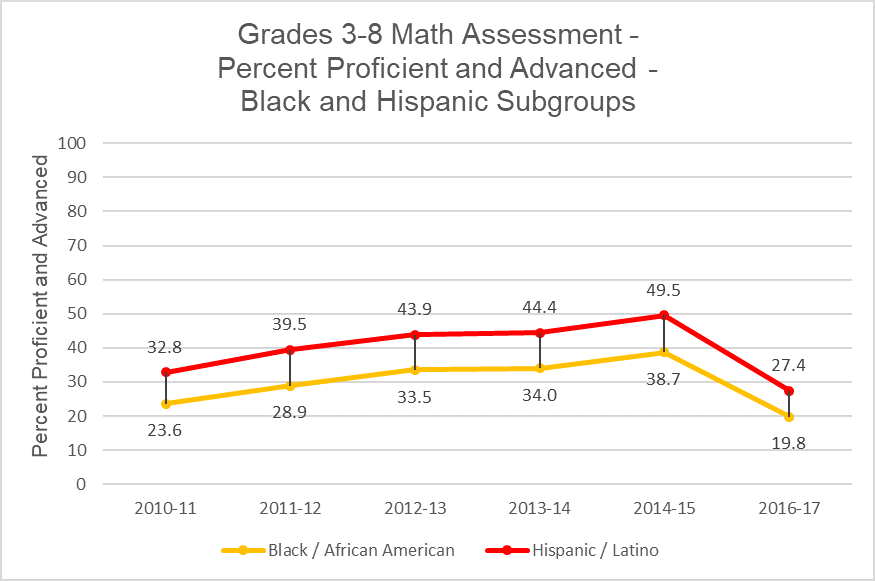
Racial/Ethnic Subgroups
Gaps in academic performance among racial/ethnic subgroups emerge early in childhood and are evident when a child first enters kindergarten. Researchers and policymakers have identified numerous factors that contribute to the racial/ethnic achievement gap. In-school factors affecting these gaps include whether a school has a high concentration of low-income students, lack of school integration, and the adequacy of educational materials and resources. Out-of-school factors include poverty, lack of economic and racial integration in housing patterns, and educational attainment of a student’s parents.
No Child Left Behind, passed in 2001, increased attention on racial achievement gaps by requiring test scores to be reported by subgroups, including by race. Since then, numerous state and federal accountability initiatives have been implemented to close achievement gaps among racial subgroups. However, these gaps persist. This issue is not unique to Tennessee – racial achievement gaps are apparent in nearly every district in the country.
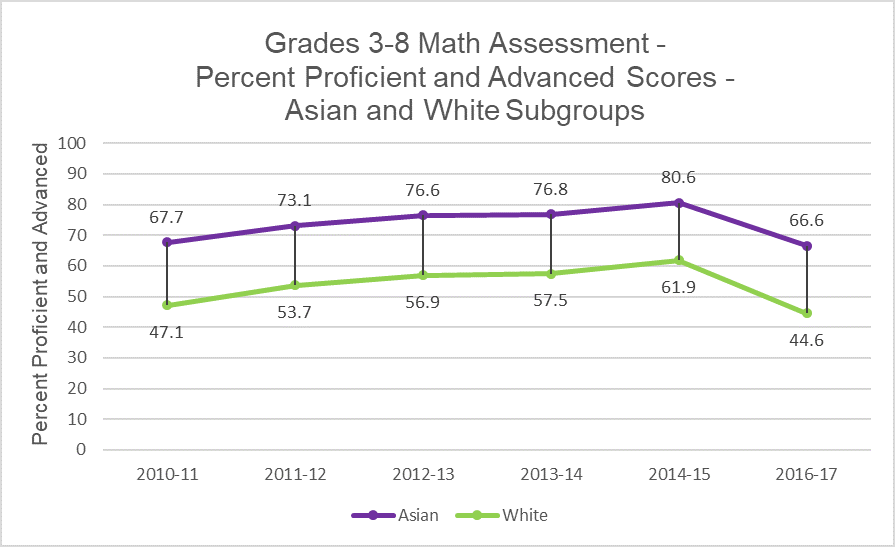
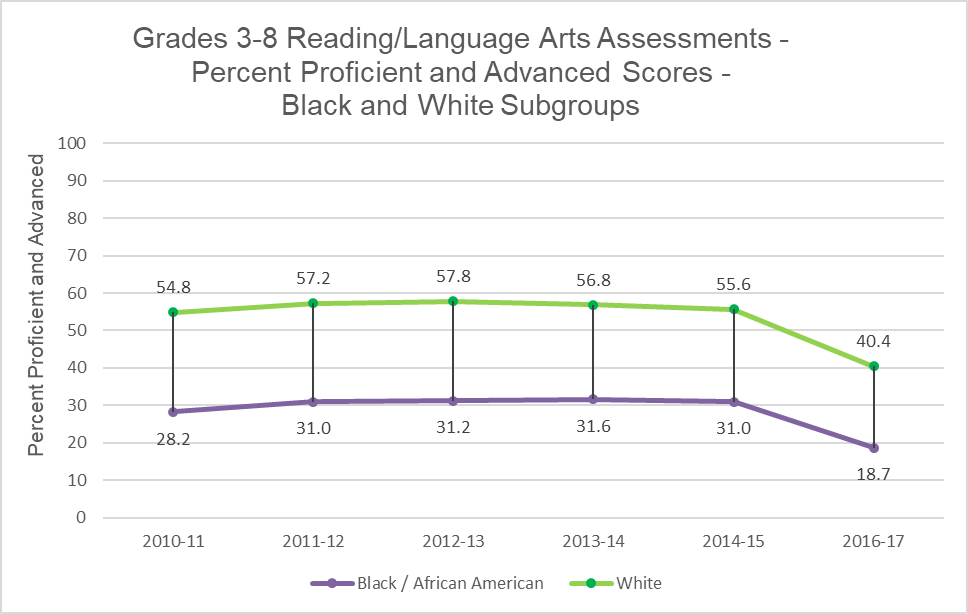
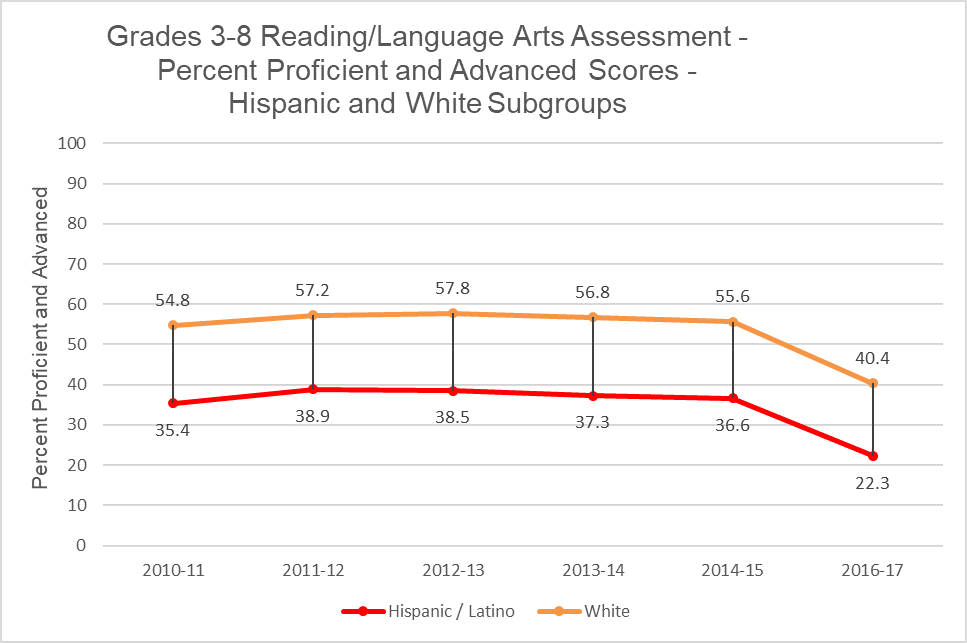
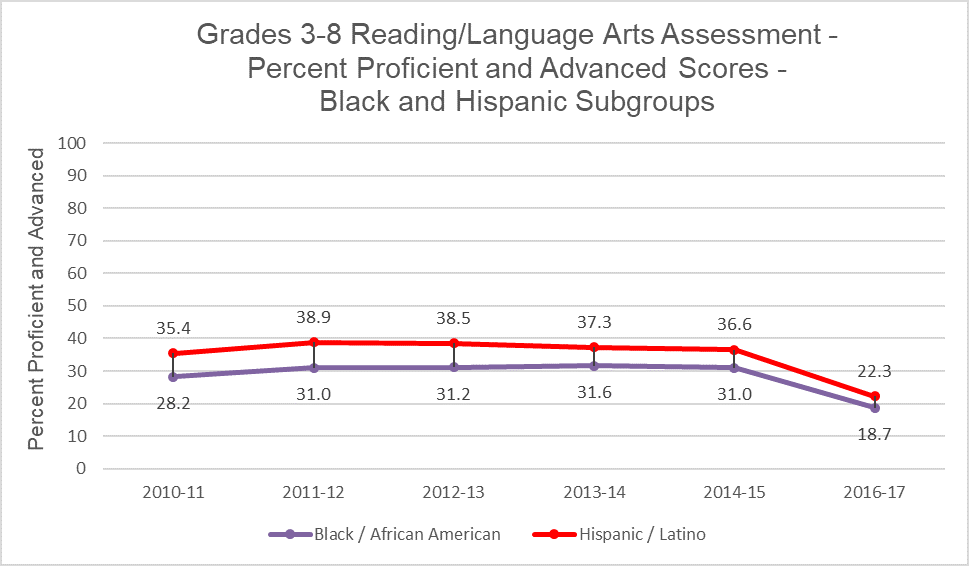
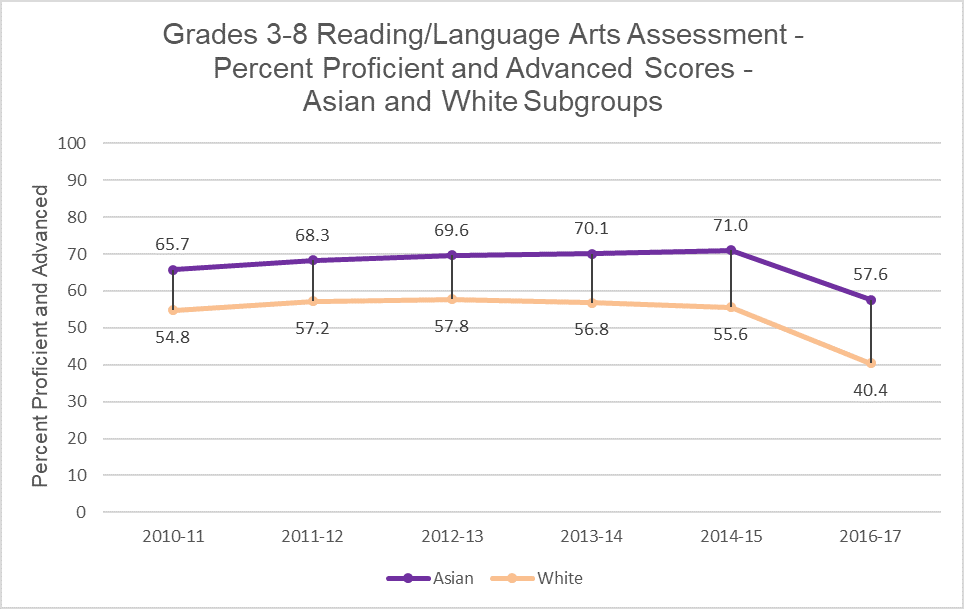
In the 2016-17 school year, African American students made up about 24.1 percent of all students in Tennessee public schools, Hispanic students about 9.7 percent, White students about 63.4 percent, and Asian students about 2.2 percent.
The charts below compare the percent of students in select racial and ethnic subgroups achieving a level of advanced or proficient on Tennessee math and reading/language arts assessments for grades 3-8 for school years 2010-11 through 2016-17. (No information is provided for 2015-16 because state testing was suspended for grades 3 through 8 that school year. A new test was given in 2016-17, which is the reason for the decrease in scores shown for that year.)
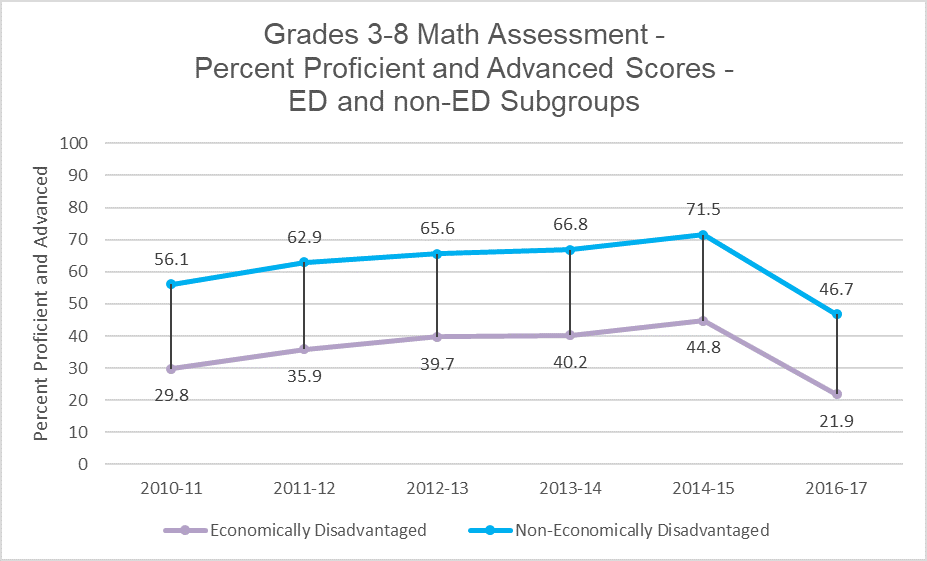
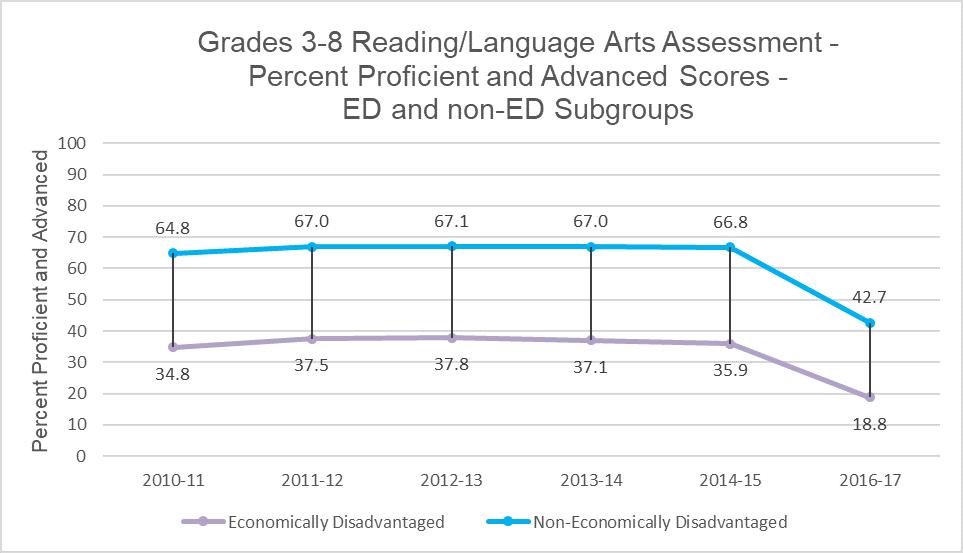
Economically Disadvantaged
Gaps in academic performance among economically disadvantaged subgroups emerge early in childhood and are evident when a child first enters kindergarten. In-school and out-of-school factors – including whether a school has a high concentration of low-income students, the adequacy of educational materials and resources, poverty, and educational attainment of a student’s parents – also affect economically disadvantaged students’ performance.
About 34.7 percent of Tennessee students met the eligibility criteria for economically disadvantaged in the 2016-17 school year.
The charts below show the difference in the percent of economically disadvantaged students and non-economically disadvantaged students achieving a level of advanced or proficient on Tennessee math and reading/language arts assessments for grades 3-8 for school years 2010-11 through 2016-17. (No information is provided for 2015-16 because state testing was suspended for grades 3 through 8 that school year. A new test was given in 2016-17, which is the reason for the decrease in scores shown for that year.)